May 25, 2025 · by Tidey Ocean Foundation · updated June 11, 2026
What Four Ocean Cleanup Organizations Publish About Their Impact
A July 2026 review of what Tidey, 4ocean, The Ocean Cleanup, and Plastic Bank publish on cost, disposal, composition, carbon, and collection source.
Anyone comparing ocean cleanup organizations runs into the same wall: the numbers are not comparable. One group reports pounds of trash, another reports bottles, a third reports kilograms without saying what fraction was plastic. This post does something narrower and more useful than ranking. For five specific measures, it reports what each of four organizations publishes, and what they do not. Tidey Ocean is one of the four, and we have applied the same standard to ourselves.
A note on method. Everything below reflects a review of each organization's public website and published reports in July 2026. Where we say a figure was not found, that means we looked and did not locate it, not that the organization refuses to disclose it. Any of these could publish more tomorrow, and we would update this accordingly. We have linked our sources so the review can be repeated.
The first measure is cost per pound collected. Tidey publishes a fully loaded cost of approximately forty cents per pound, covering collection through sorting and recycling. We did not find a published cost per pound for 4ocean, The Ocean Cleanup, or Plastic Bank. The Ocean Cleanup does publish audited annual reports going back to 2013, which is more financial disclosure than most organizations in this sector provide, so total expenditure and total collection are both public even though the ratio between them is not stated. A reader could calculate a figure from those reports, but the organization does not publish one, and any number derived that way depends on assumptions about which costs to include.
Cost per pound is also the measure most easily misread. The figure means nothing without knowing what it covers. Collection only, or collection plus sorting plus recycling? Verified weight or self-reported? Intact recyclable plastic, or mixed debris including sediment and waterlogged material? An organization reporting fifteen cents per pound for unverified mixed debris is not more efficient than one reporting forty cents for verified recyclable plastic. Those numbers describe different things.
The second measure is where the collected material ends up. Tidey has sent 1,195,010 pounds to recyclers since 2022, against 1,335,355 pounds collected since 2021. That is 89.5 percent of everything we have recovered. The remaining 10.5 percent is material that did not enter the recycling stream: moisture and dirt that came up with the plastic, non-recyclable items, and stock still sitting at our facility. We report the ratio rather than an estimate of each component, because weighing what leaves against what came in is something we can document, and splitting the remainder into categories would be a judgment call. 4ocean states that some material is recycled or repurposed and other material is responsibly disposed of, without a percentage. The Ocean Cleanup has documented that its Great Pacific Garbage Patch catch was sorted, processed, and recycled into pellets, and describes recycling river material where possible, without publishing a percentage. Plastic Bank holds Global Recycled Standard certification and sells recovered material as feedstock, which implies a high recycled share, but we did not find a published rate.
The third measure is what the collected material actually consists of. This one matters more than it sounds, because a pound of clear PET and a pound of waterlogged mixed debris have very different environmental value. In 2025 Tidey's collection was 48.9 percent PET bottles, 38.0 percent LDPE film, 9.3 percent polypropylene string, and 3.8 percent mixed material. Plastic Bank publishes the material types it handles, PET, HDPE, LDPE and polypropylene across fourteen product specifications. 4ocean and The Ocean Cleanup both report their totals as trash rather than as plastic, and we did not find a published composition breakdown for either. The Ocean Cleanup does assess trash composition as part of its independent verification process, so the data exists, but it is not published as a percentage.
Composition disclosure matters for a reason that is easy to miss: a meaningful share of what any cleanup operation pulls out of the environment is not plastic at all. Wet material carries water. Debris dragged off a riverbank carries sand, sediment, and organic matter. Some of that organic material is vegetation that would have broken down on its own and did not need removing at all. It simply came up together with the plastic. This is why we publish both numbers: what we collected and what we sent to recyclers. The gap between the two, 10.5 percent across five years, is the honest measure of how much of a collection total is not recoverable plastic. We do not have to estimate it, because both ends are weighed. An organization that reports only what it collected, and never what left the facility, is publishing a figure that cannot be translated into environmental impact, because the share that was actually plastic is unknown to the reader and possibly to the organization.
This is where the comparability problem becomes concrete. The Ocean Cleanup reports more than 50 million kilograms of trash. 4ocean reports more than 50 million pounds of trash. Plastic Bank reports 10.1 billion bottles. Tidey reports pounds of plastic by resin type. Four organizations, four units.
Those units can be reconciled, up to a point, and the arithmetic is worth doing. Plastic Bank publishes a conversion factor: its Bottle2KG study, run across more than 100 collection branches in the Philippines and Indonesia, measured an average of 56.39 PET bottles per kilogram, and the organization rounds down to 50 bottles per kilogram as a deliberately conservative public metric. Applying that published factor, Plastic Bank's 10.1 billion bottles convert to roughly 202,000 tonnes, or about 445 million pounds. The Ocean Cleanup's 50 million kilograms convert to about 110 million pounds. 4ocean reports roughly 50 million pounds directly. Tidey has collected 1,335,355 pounds since June 2021. On a single scale the ordering is unambiguous, and we are by a wide margin the smallest of the four.
The conversion exposes the problem rather than solving it. Substituting Plastic Bank's own measured figure of 56.39 bottles per kilogram for its published 50 moves the same organization's total from about 445 million pounds to about 395 million pounds. That 50 million pound swing comes entirely from choosing between two conversion factors the same organization published, and it is larger than 4ocean's entire reported lifetime total. Underneath that, the deeper issue is untouched: two of the four report trash rather than plastic, so an unknown share of those totals is water, sediment, and organic material. Converting an unknown into a shared unit produces a number that looks comparable and is not. The arithmetic is easy. The composition disclosure that would give the arithmetic meaning is what is missing.
The fourth measure is carbon accounting. Tidey published a full operational carbon inventory for 2025: 13,910 kilograms of CO2 equivalent emitted across vehicles, flights, freight, refrigerant and electricity, against approximately 229,000 kilograms of CO2 avoided by preventing open burning of the plastic we recovered. It has not been independently audited, and we said so when we published it. We did not find published carbon figures for 4ocean or Plastic Bank. The Ocean Cleanup references a Net Environmental Benefit Assessment concluding that cleaning the garbage patch delivers more environmental benefit than cost, but we did not find emissions figures attached to it. Plastic Bank holds an EcoVadis Gold rating placing it in the top five percent assessed as of December 2024, which covers environmental management broadly rather than carbon specifically.
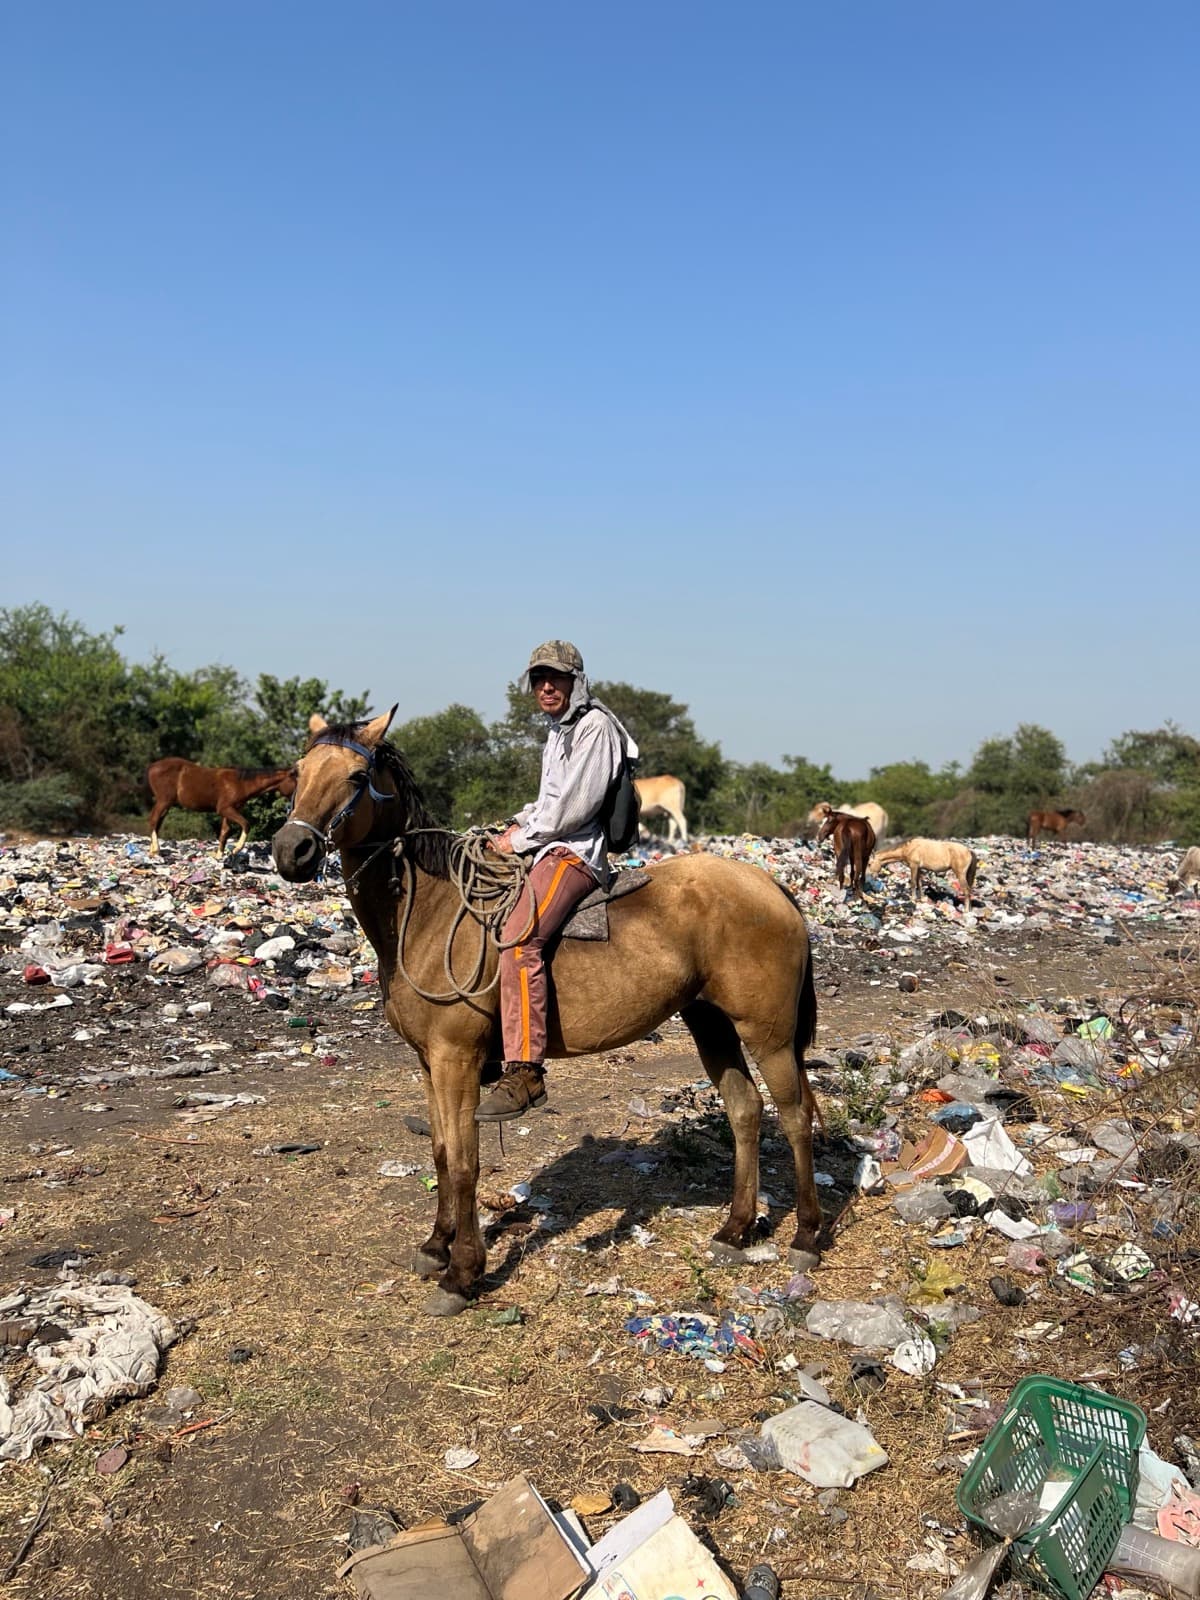
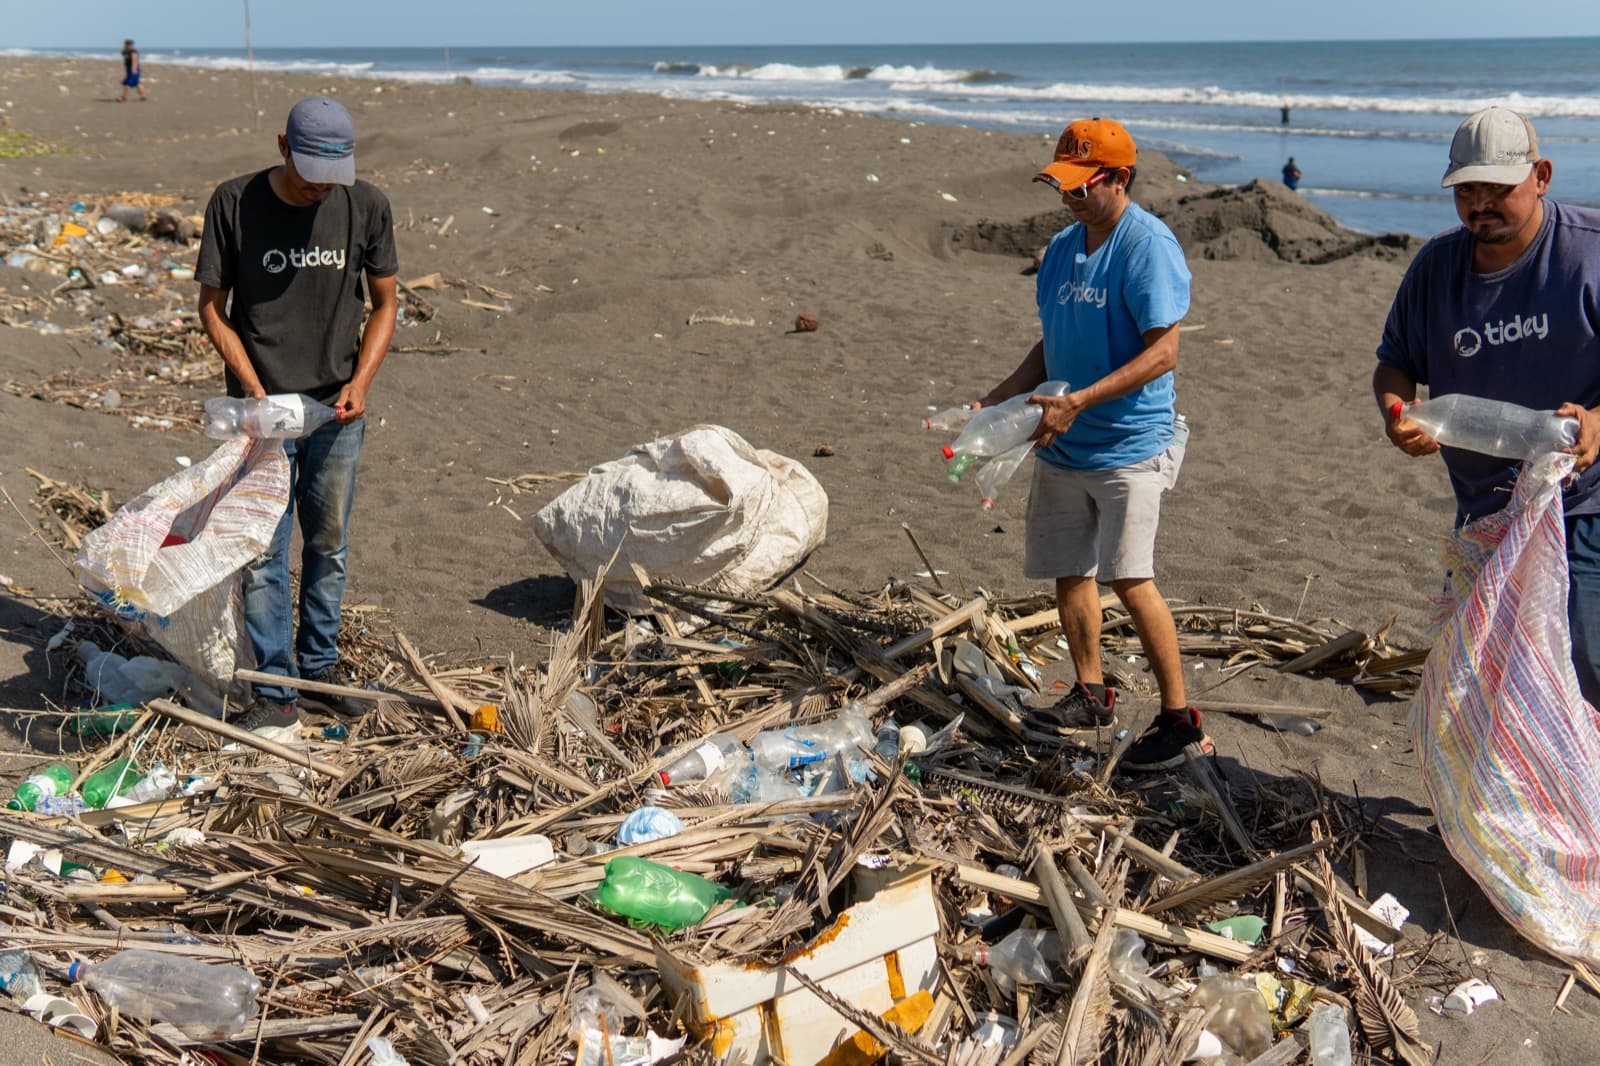
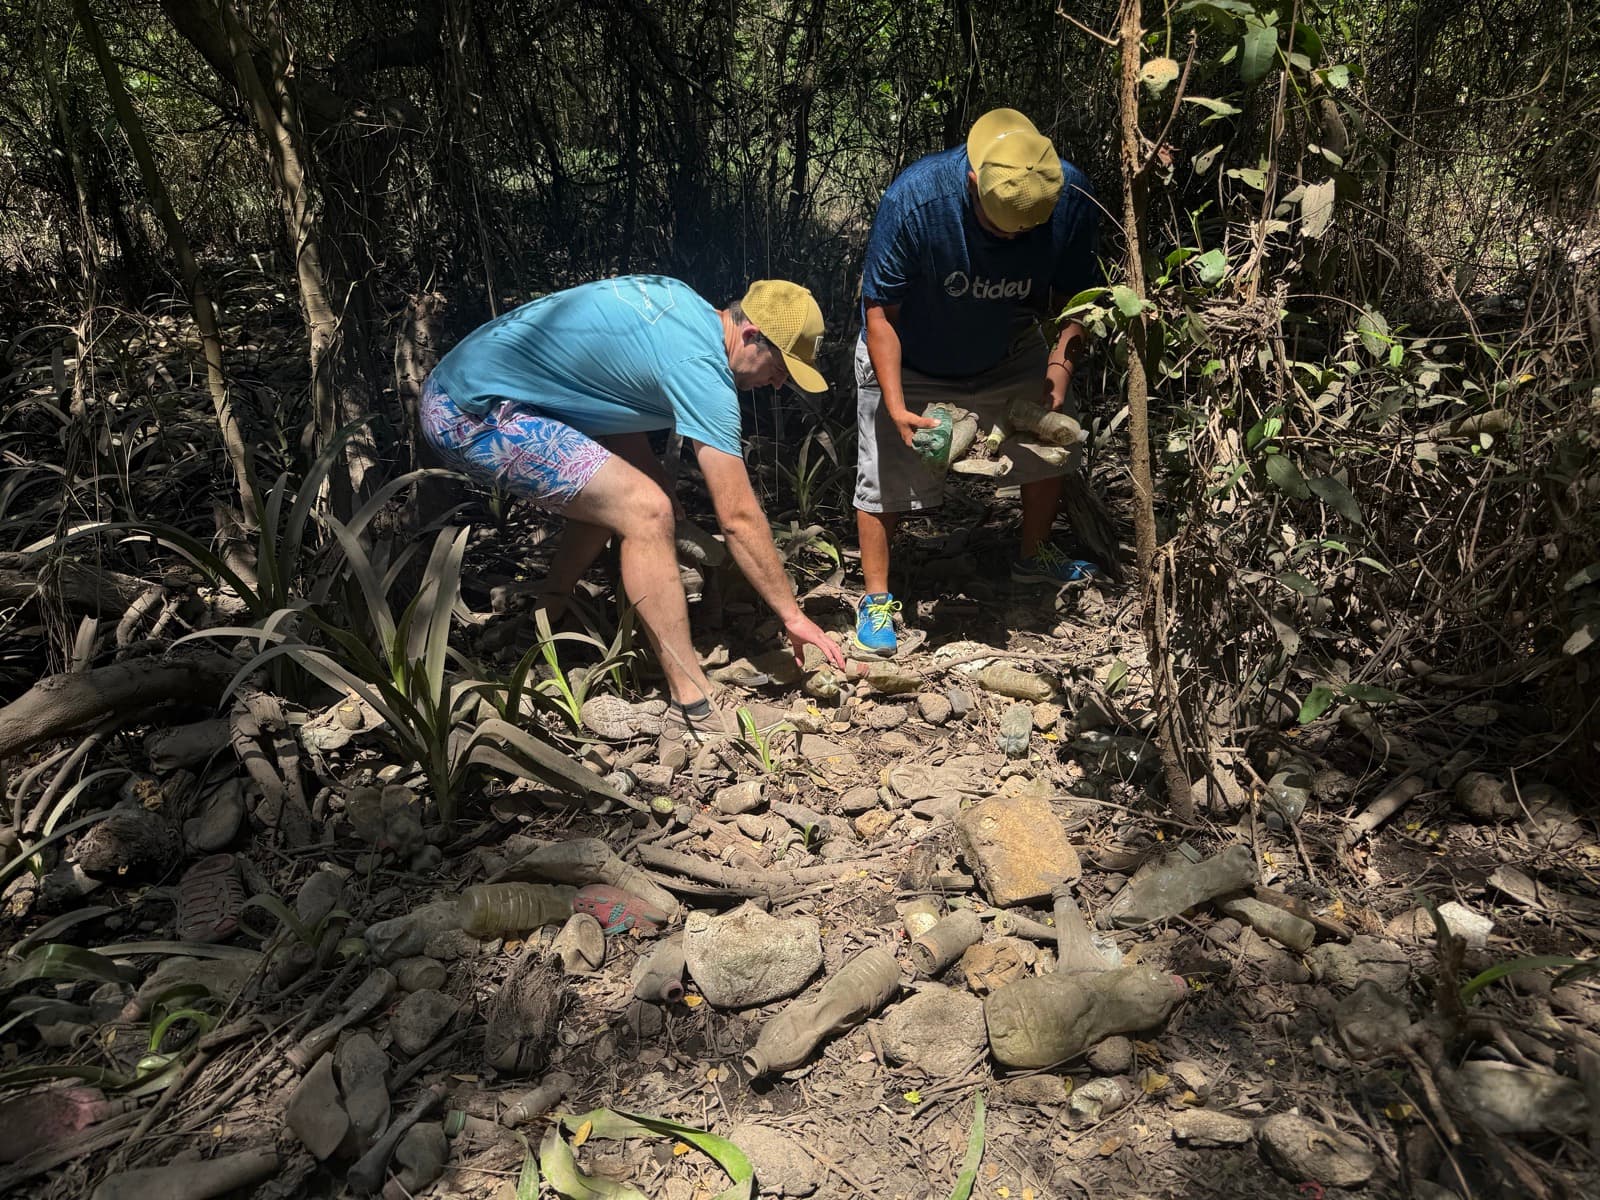
The fifth measure is the breakdown of where material is collected, and it is the one almost nobody publishes. The distinction matters because organizations market themselves on ocean plastic while collecting most of their material inland, which is legitimate work but a different claim. In 2025, 97.6 percent of Tidey's collection came from individual community collectors, 1.9 percent from schools, and 0.5 percent from organized cleanup events. For 2026 so far that is 99.4 percent, 0.4 percent, and 0.15 percent. Organized beach cleanups, the activity most associated with ocean plastic work publicly, are a rounding error in our tonnage. The Ocean Cleanup publishes a genuine split, separating river interception from ocean collection on its public dashboard, which is the clearest source disclosure we found from any organization in this review. 4ocean describes collecting from oceans, rivers and coastlines but we did not find a breakdown among them. Plastic Bank operates through community collection rather than ocean recovery, though we did not find this stated as a proportion.
On verification, which underlies every measure above, the four organizations differ substantially and not in our favor. The Ocean Cleanup engages DNV, an independent assurance body, to verify its catch figures, reviewing offloading records, waste handler receipts, photographs, data logs, composition assessments, transport records and weigh receipts. It was the first organization in this sector to have a certification body verify its traceability systems, and it co-developed an ocean plastic standard with DNV. Plastic Bank holds EcoVadis and Global Recycled Standard certifications. Tidey logs every transaction on the BanQu blockchain with collector, weight, timestamp and location, which gives transaction-level traceability that donors can inspect directly, but we want to be precise about what that is and is not. A blockchain record makes a transaction permanent and auditable. It does not independently confirm that the weight entered was correct. That is what an assurance body does, and on that specific measure The Ocean Cleanup discloses more than we do.
We should be equally direct about our other gaps. Roughly nine percent of our individual collection volume historically sits under a generic collector entry rather than a named individual, from a period when our field recording was less disciplined than it is now. Our carbon inventory is unaudited and is our first. Our composition percentages are reliable from 2024 onward, because our earlier material categories tracked credit programs rather than physical materials. We are publishing these numbers with their limitations attached rather than waiting for a version with no caveats, because a number with a stated limitation is more useful than a number with a hidden one.
None of this is an argument that one of these organizations is better than the others. They operate different models at different points in the plastic lifecycle, and the scale of the problem, with UNEP estimating 19 to 23 million tonnes of plastic leaking into aquatic ecosystems each year, is large enough to absorb every credible effort. The argument is narrower: donors deserve to know which claims are checkable. An organization that publishes a composition breakdown is making a claim you can test. An organization that reports total trash is making a claim you cannot.
What should a donor ask before giving to an ocean cleanup organization? Ask what the cost per pound includes and whether the weight was verified by anyone outside the organization. Ask what percentage of collected material is actually recycled, not what happens to it in general terms. Ask what the material consists of. Ask where it was collected, specifically what share came from open water versus rivers versus community collection inland. And ask what the organization publishes about its own emissions, not just what it avoids. An organization that can answer all five has done the measurement work. One that answers none may still be doing good work, but you are taking it on faith.
Can these different volume figures be converted into one standard measure? Partly, and it is worth doing. Plastic Bank publishes a rate of 50 bottles per kilogram, kilograms convert to pounds directly, and on that basis the four organizations line up at roughly 445 million pounds for Plastic Bank, 110 million for The Ocean Cleanup, 50 million for 4ocean, and 1.34 million for Tidey. The arithmetic works. What it cannot fix is that two of those totals describe trash rather than plastic, and that none of the four except Tidey publishes what share of collected weight was contamination rather than recoverable material. A converted figure resting on undisclosed composition is precise without being accurate, and precision of that kind is how a reader gets misled. Until composition reporting converges, the most useful comparison is each organization against its own prior disclosures.
Why publish a review that shows another organization disclosing more than we do? Because a comparison that concluded we win on every measure would not be worth reading, and would not be true. The Ocean Cleanup's independent verification through DNV is stronger than our blockchain logging on the specific question of whether reported weights are accurate. Plastic Bank publishes a collector count and holds certifications we do not. Publishing that alongside the measures where our disclosure is more detailed is the only version of this post that is worth a reader's trust.
Sources
- The Ocean Cleanup. Year in Review 2025. https://theoceancleanup.com/updates/2025-in-review-the-ocean-cleanup/
- The Ocean Cleanup. The Numbers Behind Our Catch (DNV verification). https://theoceancleanup.com/updates/the-numbers-behind-our-catch/
- The Ocean Cleanup. Rivers and the Interceptor. https://theoceancleanup.com/rivers/
- The Ocean Cleanup. Foundation details and annual reports. https://theoceancleanup.com/foundation-details/
- 4ocean. Inside the Company That Removed Over 50 Million Pounds. https://www.4ocean.com/blogs/impact/inside-the-company-that-removed-over-50-million-pounds-of-trash-from-the-ocean
- Plastic Bank. Homepage impact figures and certifications. https://plasticbank.com/
- Plastic Bank. Social Plastic feedstock specifications. https://plasticbank.com/social-plastic/
- UNEP. Plastic Pollution and Marine Litter. https://www.unep.org/topics/ocean-seas-and-coasts/ecosystem-degradation-pollution/plastic-pollution-and-marine-litter
- Plastic Bank. Understanding the Equivalent Bottle Impact Metric (Bottle2KG study). https://plasticbank.com/blog/understanding-plastic-banks-equivalent-bottle-impact-metric/
Monthly, from the field in Guatemala.
Collection numbers, new research on plastic and health, and what we are learning in the field. No more than once a month.