
Tidey Ocean Impact
Numbers you can trace.
Every figure below carries the date it covers and a line on what it includes. Where our records are incomplete, we say so on this page rather than round the gap away.
Pounds collected
As of July 2026
Every pound recorded in our Guatemala field registry since June 2021.
Pounds sent to recyclers
As of July 2026
Material sold or shipped to recycling partners, from the registry's Plastico vendido sheets. The registry has tracked sales since 2022.
Collectors paid directly
As of July 2026
People paid directly for the plastic they collected, deduped from the BanQu roster. 220 counting schools, organized cleanups, and other group sources. Provisional while three name variants are confirmed.
89.5%
As of July 2026
Share of collected weight sent on to recyclers. The other 10.5% is moisture and dirt that came up with the plastic, non-recyclable items, and stock still sitting at our facility. We report the ratio rather than an estimate of each component, because weighing what leaves against what came in is something we can document.
Impact figures last updated July 30, 2026. Source: our Guatemala field registry and the BanQu collector roster.
New numbers, once a month.
Collection numbers, new research on plastic and health, and what we are learning in the field. No more than once a month.
Where the plastic comes from
Almost all of it comes from people, not events.
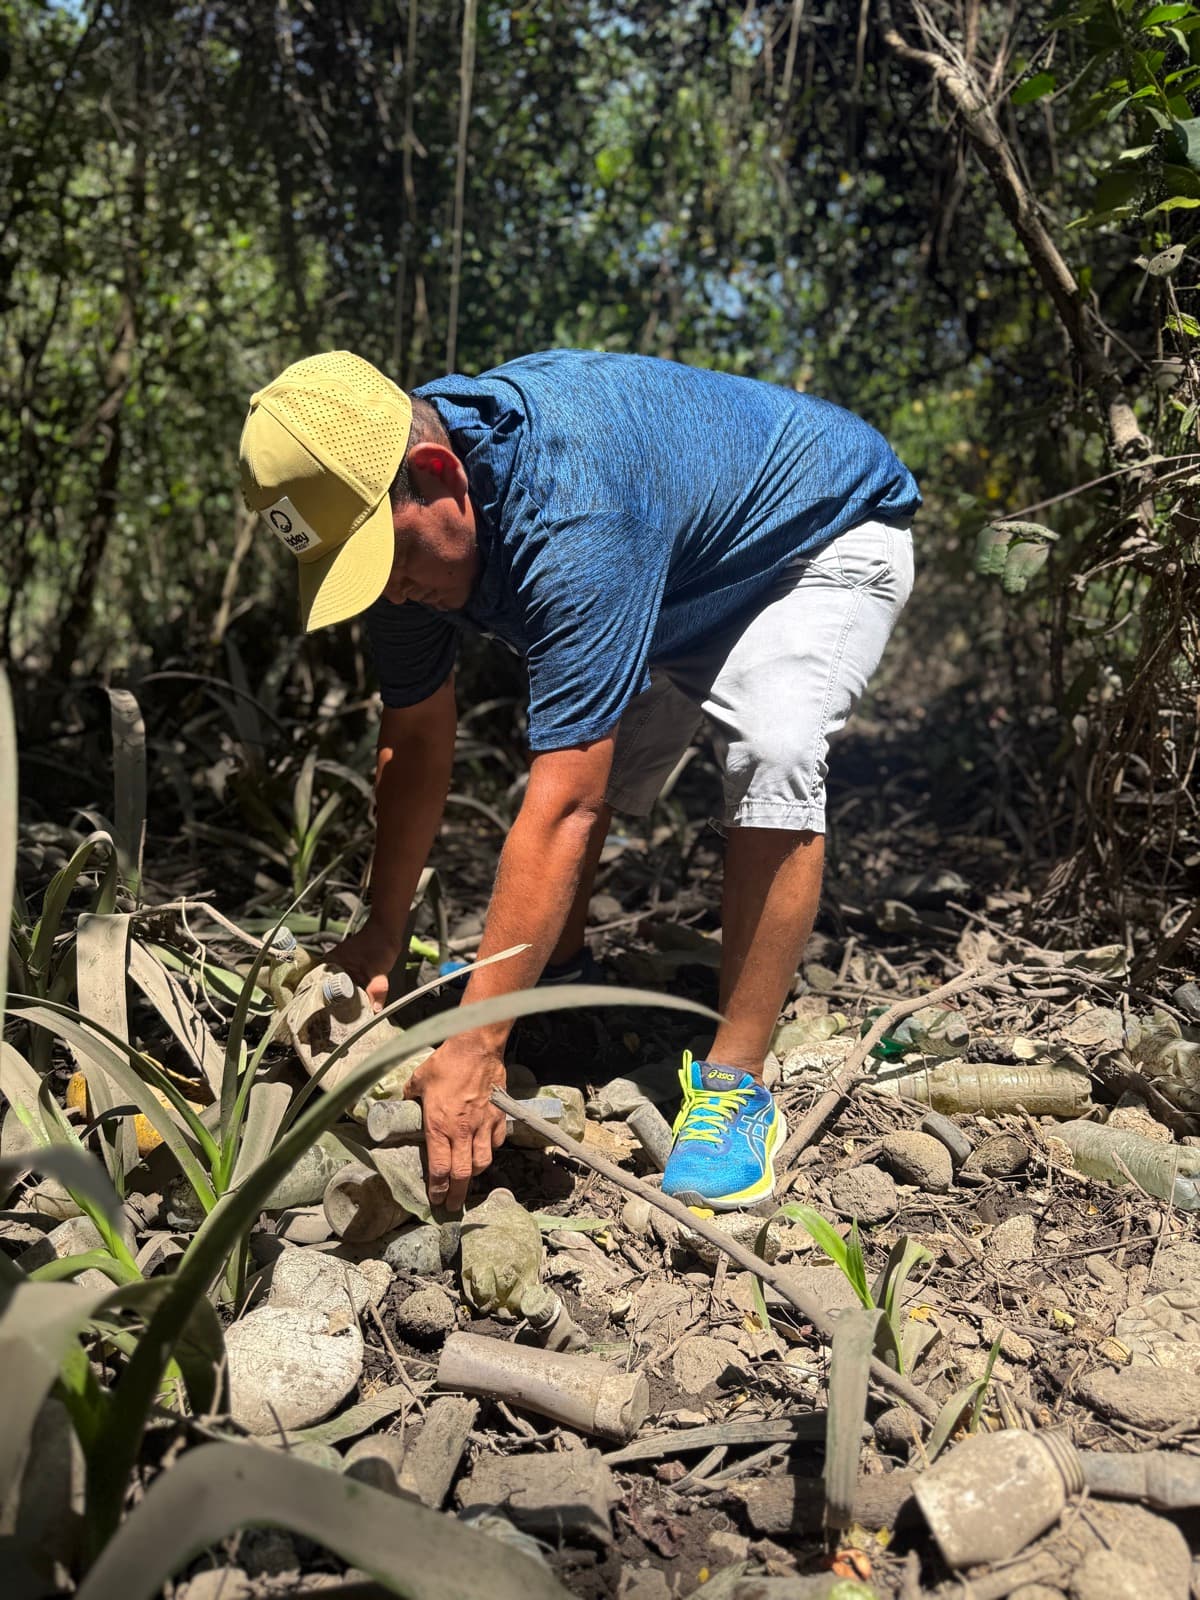
Organized beach cleanups are the image most people have of ocean plastic work. They are a small share of ours. The weight comes from individual collectors working their own rivers, mangroves, and neighborhoods, paid by the pound when they deliver.
Share of collected weight by the type of source that recovered it. Figures cover 2025, with 2026 year to date shown alongside.
99.4% in 2026 year to date
0.4% in 2026 year to date
0.15% in 2026 year to date
What we collect
What the 2025 weight was made of.
Share of collected weight by material. HDPE is counted inside Mixed.
48.9%
PET
38.0%
LDPE film
9.3%
PP string
3.8%
Mixed
Carbon, 2025
What our own operations cost the climate.
Our first full-year carbon inventory. It is unaudited.
13,910 kg
CO2e we emitted
~229,000 kg
CO2 avoided
more than 16 to 1
Avoided against emitted
Where our 13,910 kg came from
7,496
Vehicles
4,024
Flights
937
Freight
765
Refrigerant
688
Electricity
Net benefit of 0.69 kg CO2 per pound recycled, against an operational cost of 0.045 kg CO2e per pound.
Where we work
Two rivers on the Pacific coast of Guatemala.
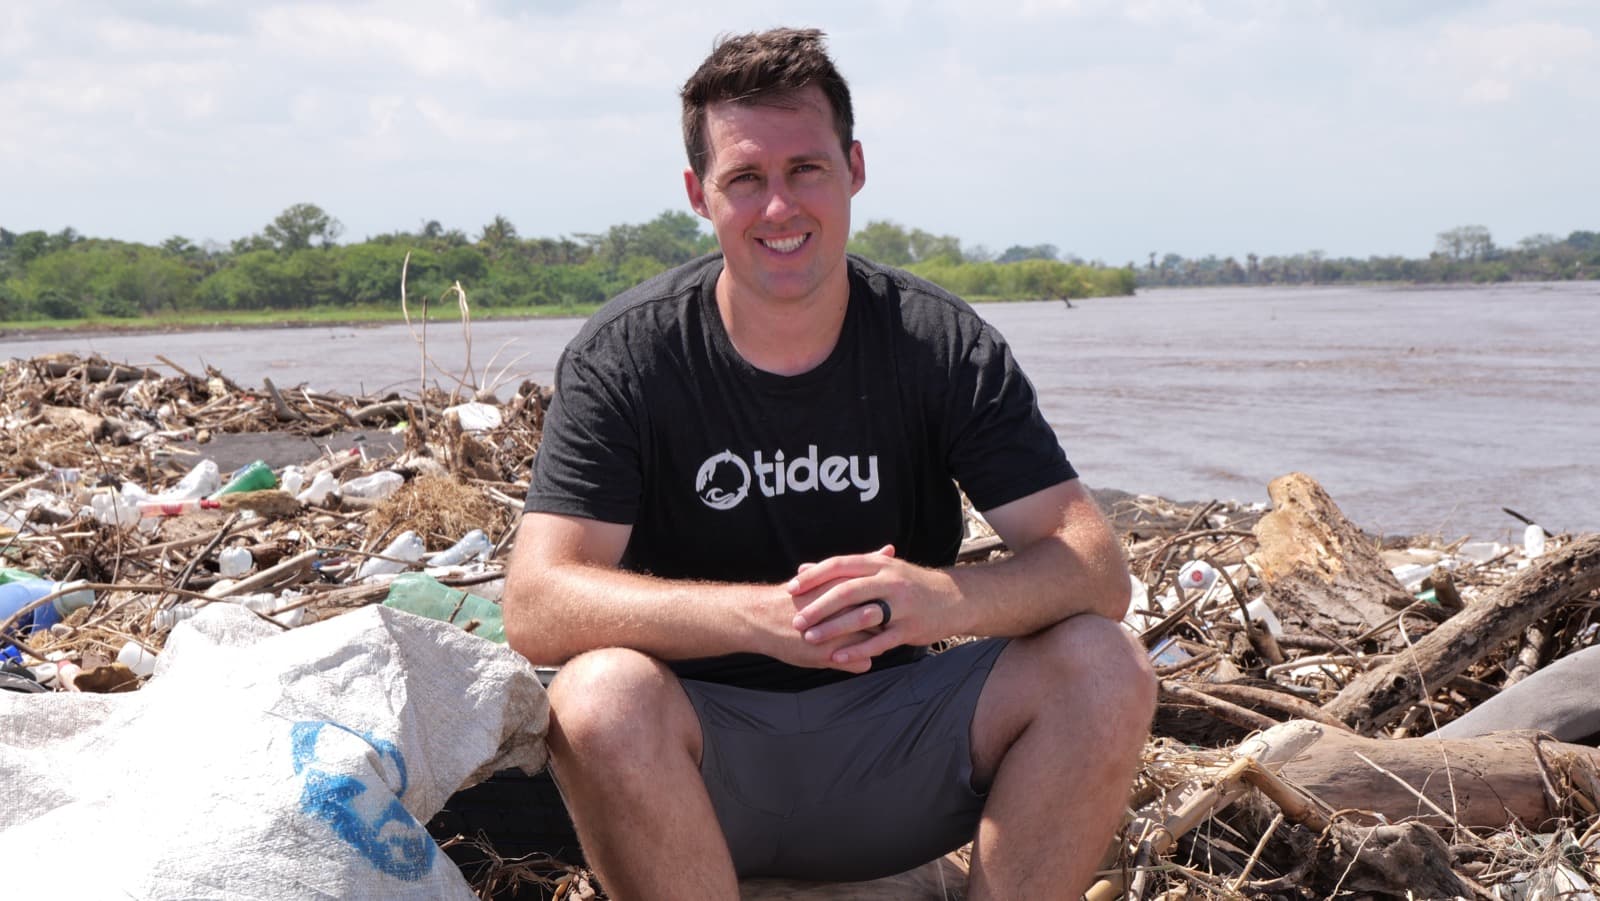
The Ocean Cleanup's river emissions model puts the Maria Linda at 1,043,800 kilograms of plastic reaching the ocean each year, and the nearby Achiguate at 441,900. That is roughly 3.3 million pounds between them, as read from their source map in July 2026. Tidey Ocean operates collection hubs along both rivers, paying local crews to recover plastic before it reaches the gyre.
Those are modeled emission figures, meaning plastic the model estimates reaches the ocean, not the far larger volume of mismanaged waste generated across the catchment. The underlying research is Meijer et al. (2021) in Science Advances. The map notes a scientific update is pending, so we re-check these numbers rather than treat them as fixed.
That focus is intentional. The plastic ocean crisis isn't solved by cleaning the open ocean. It's solved by closing the source rivers that feed it.
Our collectors
205 people paid for what they collected.
The work happens upstream, in the communities where ocean plastic begins. Collectors are paid directly, by the pound, at the point of collection.
Silverio
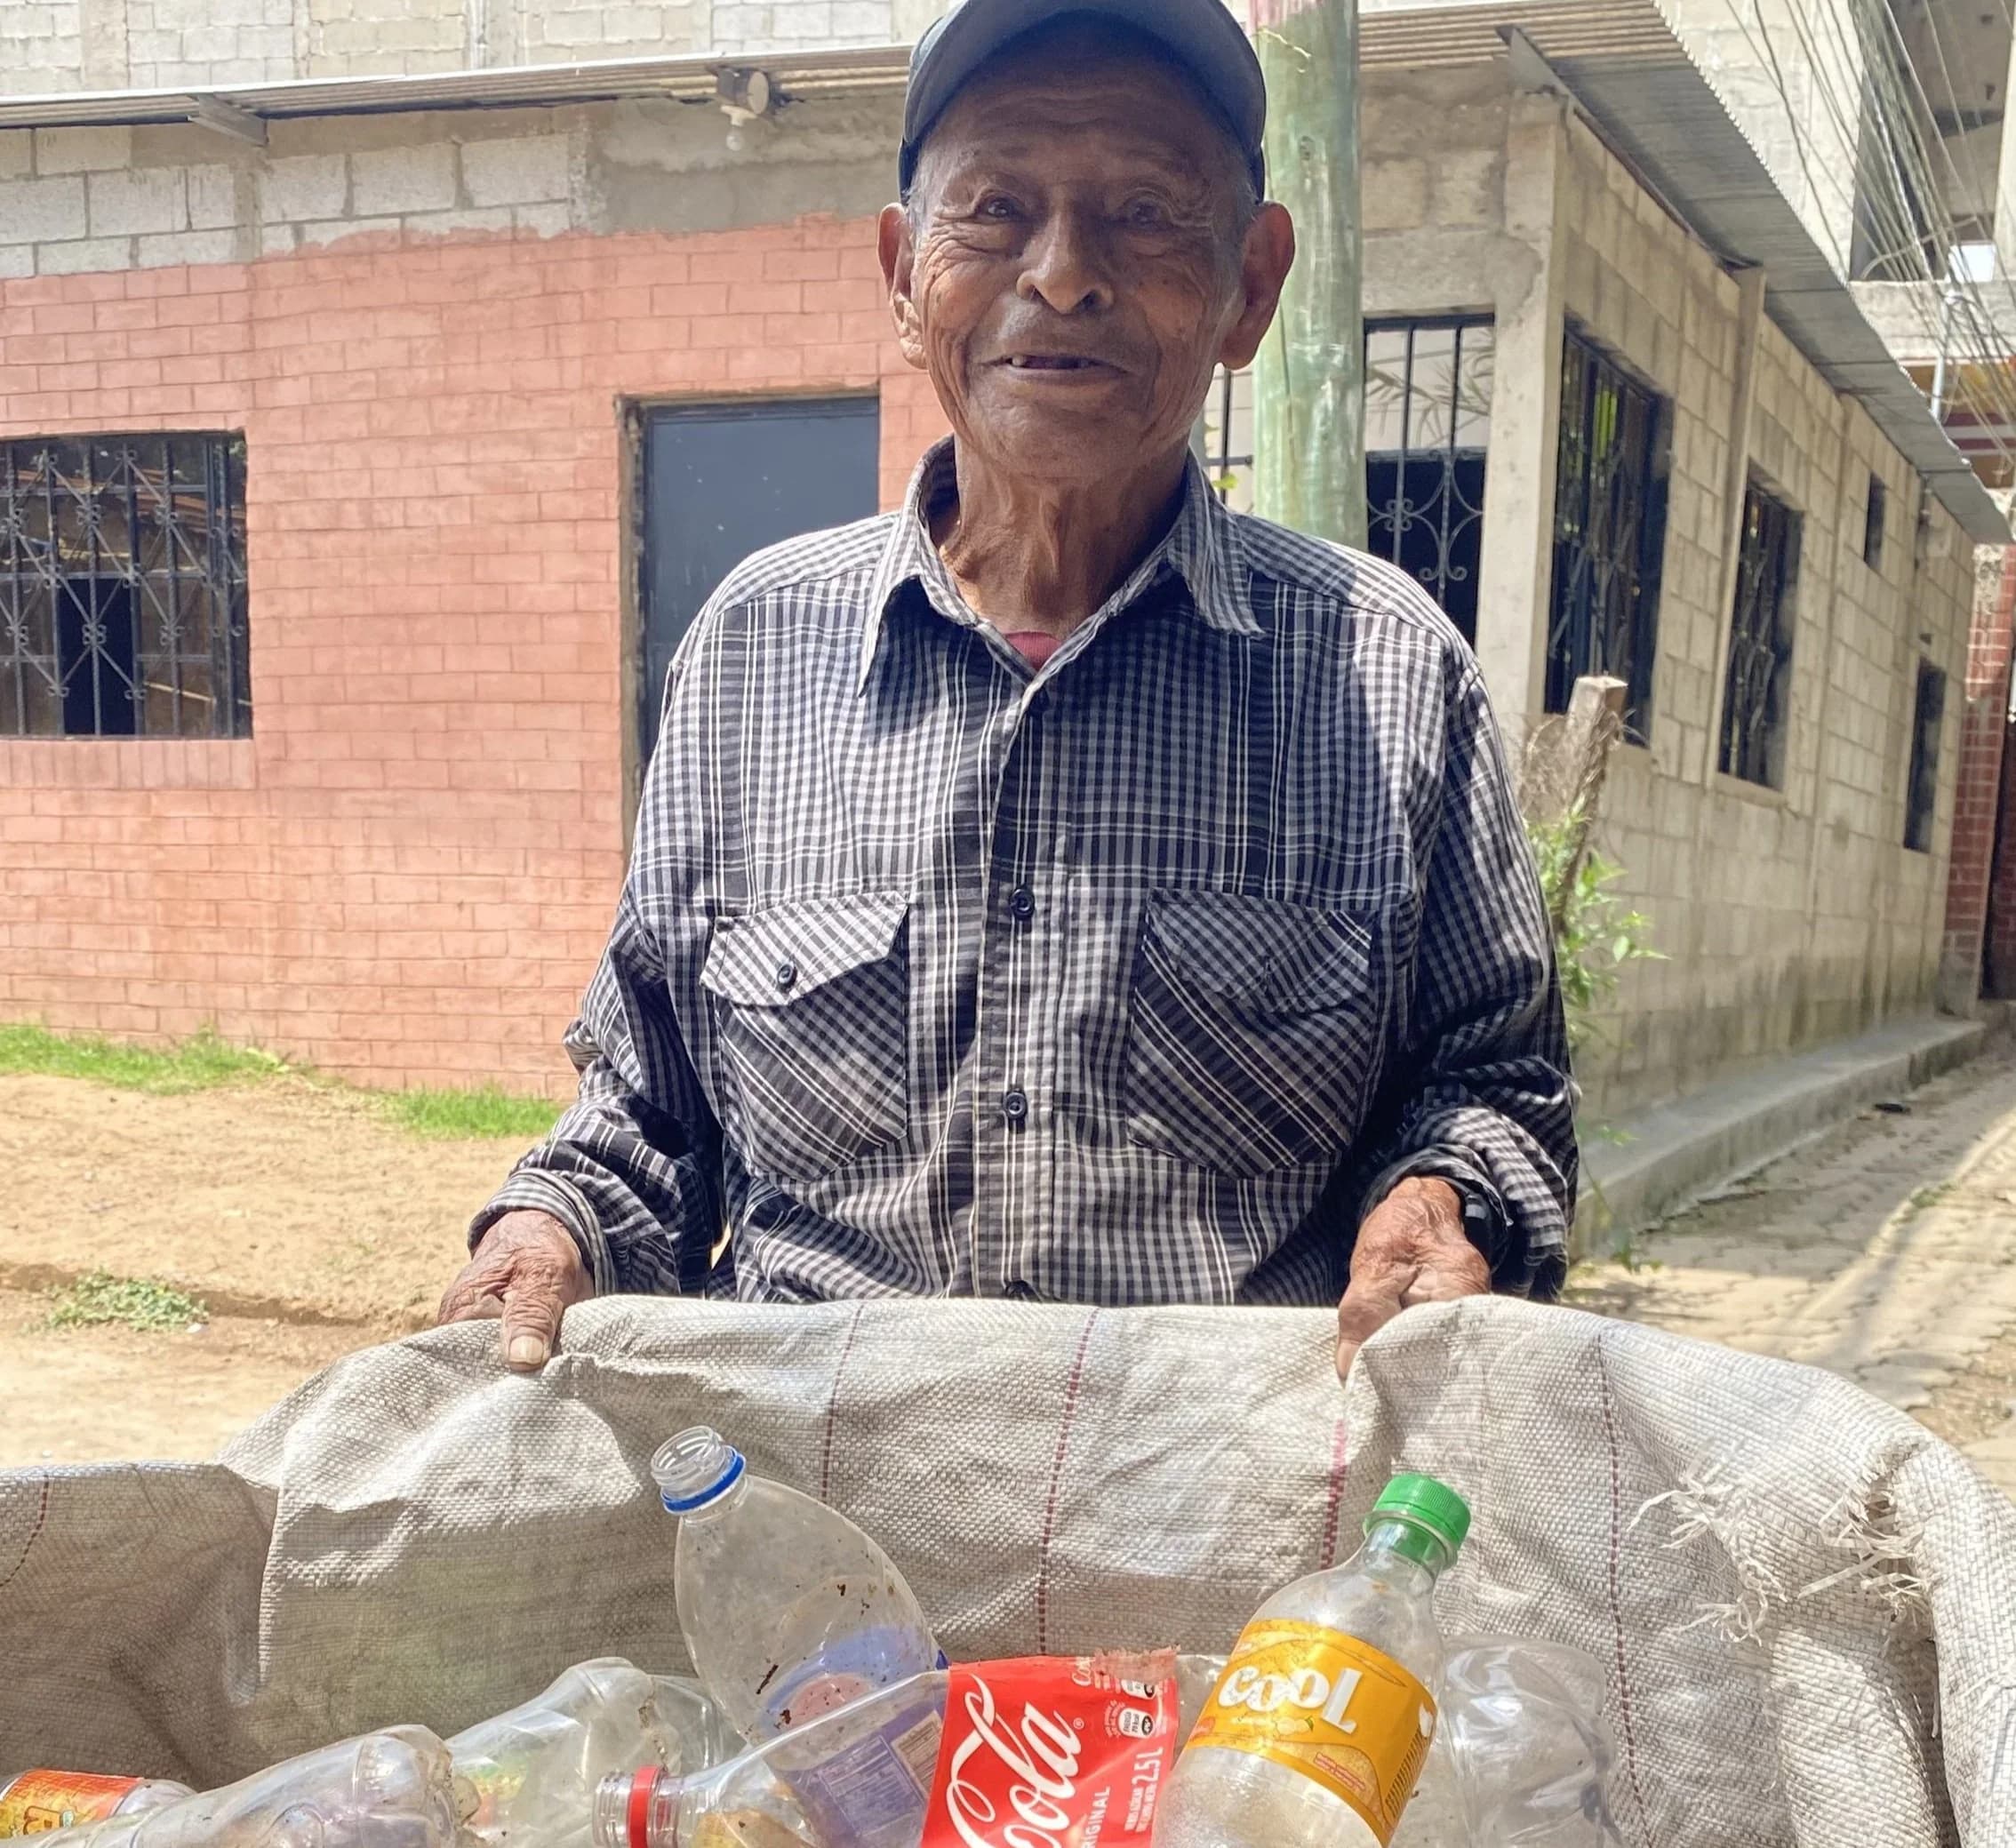
Maria Linda river, GuatemalaSilverio is 88 years old, but doesn't let his age stop him from creating impact. He lives with his children and grandchildren, and loves the opportunity to support them by collecting plastic from the riverbanks.
Marleni
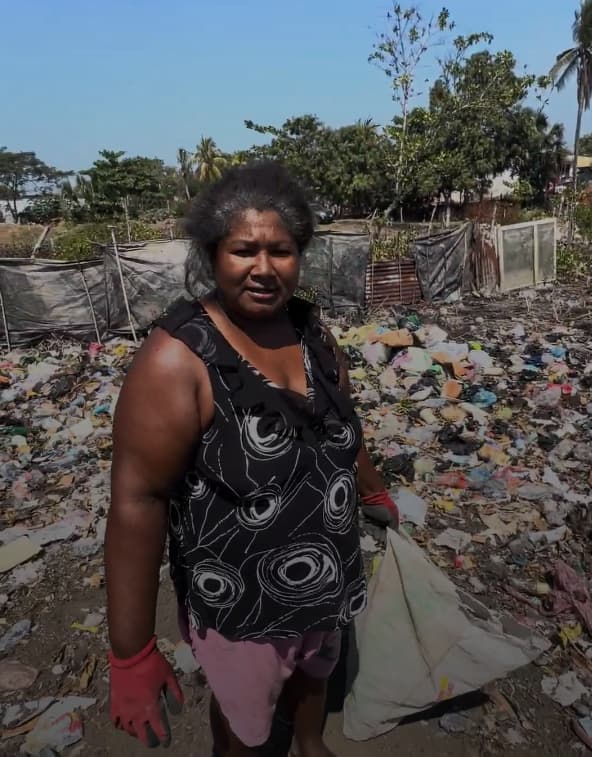
Mangroves, Pacific coastMarleni lives next to mangroves that are becoming overridden with trash. She does important work collecting plastic from the mangroves to keep them from being destroyed.
Local team
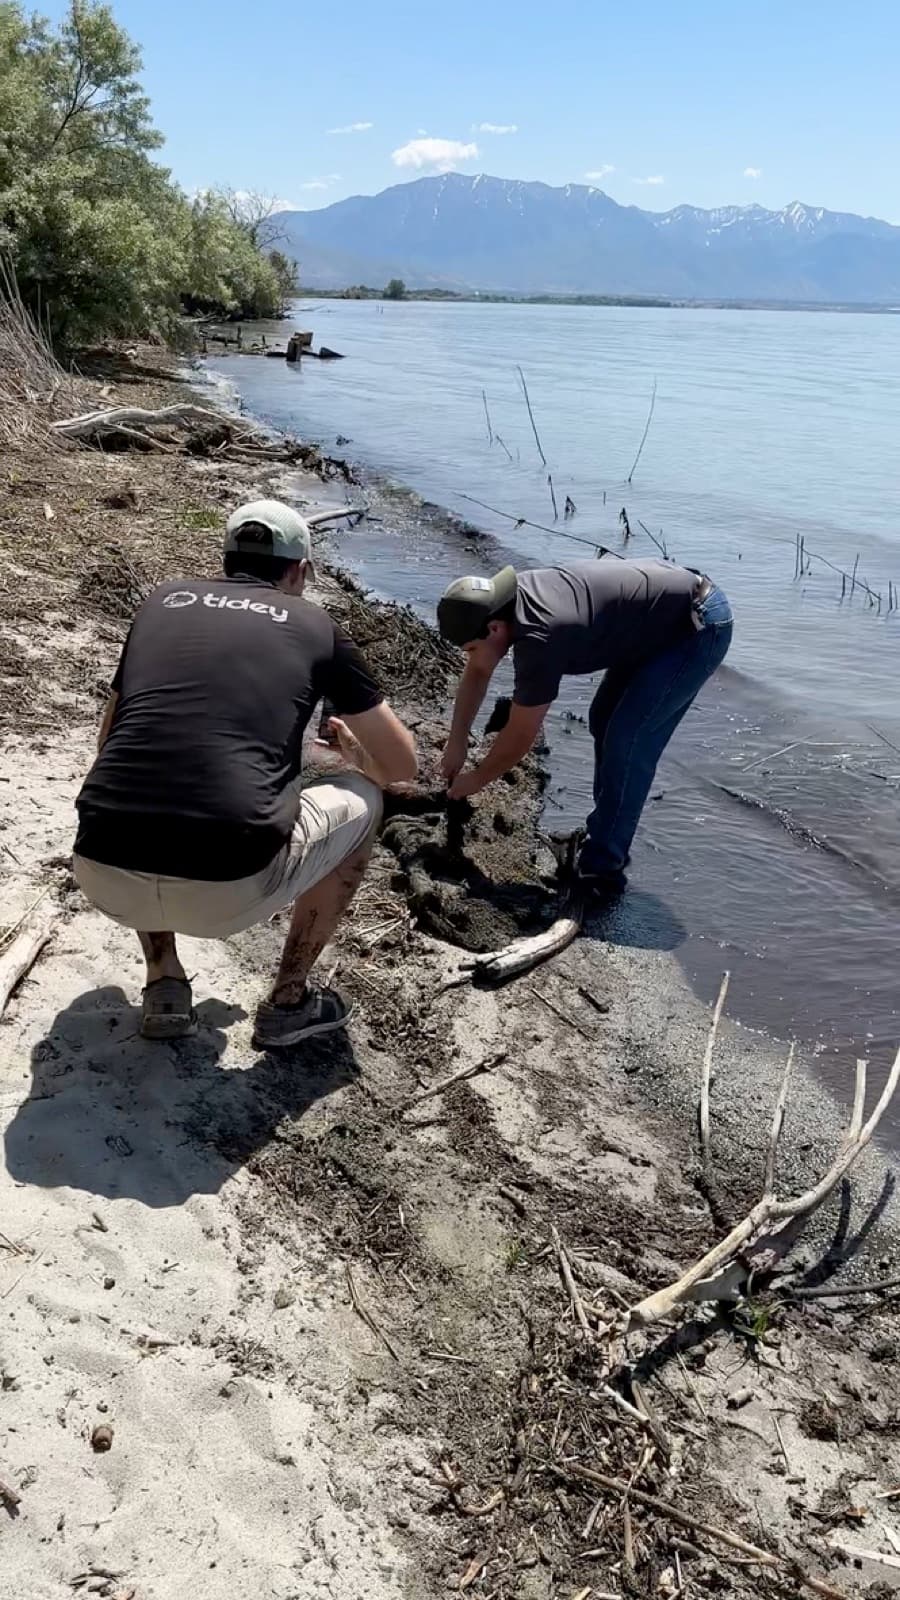
Coastal GuatemalaOur crew runs scheduled cleanups along high-leakage rivers and shorelines. Deliveries are logged with the date, the weight, and the collector who brought them in.
A note on what changed
We retired a metric instead of updating it
We previously reported the number of fair-wage workdays funded per 100 pounds collected. We have retired that metric. Our methodology for calculating it was not robust enough to publish with confidence, and we would rather report a number we count than one we estimate. In its place we now publish the total number of collectors we pay directly.
What our records show, and what they don't.
We track collection on BanQu, a blockchain-based traceability platform. Each delivery records the date, the weight, and the collector who brought it in. Coverage is not uniform across every year, so here is where the record has gaps.
- About 9% of historical collection by individuals sits under a generic collector entry with no name attached to it.
- Location is captured where field conditions allow. Across all collection legs to date that is roughly half, and it varies widely by year.
- Nylon and LDPE deliveries appear in BanQu at zero pounds, with the actual weight held in our recycling partner's system.
How the 2025 volume is credited
62%
Credited through BanQu
38%
Registered through CleanHub
Our customers claim plastic credits through BanQu. CleanHub separately sells credits on the LDPE volume registered in its own system, which was 38% of 2025 collected weight. The rest is credited through BanQu. We report total collection, so we state the split rather than leave it implicit.
50 cents recovers one pound of ocean-bound plastic.
$10 = 20 pounds. $30 = 60 pounds. $50 = 100 pounds. $100 = 200 pounds.
It costs us about 40 cents to collect, sort, and recycle a pound of plastic, including our operations in Guatemala and our U.S. administration. Selling the recycled material in Guatemala covers part of that. We ask 50 cents a pound so every gift covers the full cost, with room to invest in growing the program. That is not the rate we pay a collector. Collectors are paid directly, by the pound, when they deliver, and that rate is set separately from what a donation costs.
Donate now