December 4, 2025 · by Tidey Ocean Foundation · updated June 11, 2026
How to Gauge the Real Impact of an Ocean Cleanup Organization
Six metrics separate organizations that document real ocean plastic impact from those that produce compelling marketing. Here is how to apply each one.
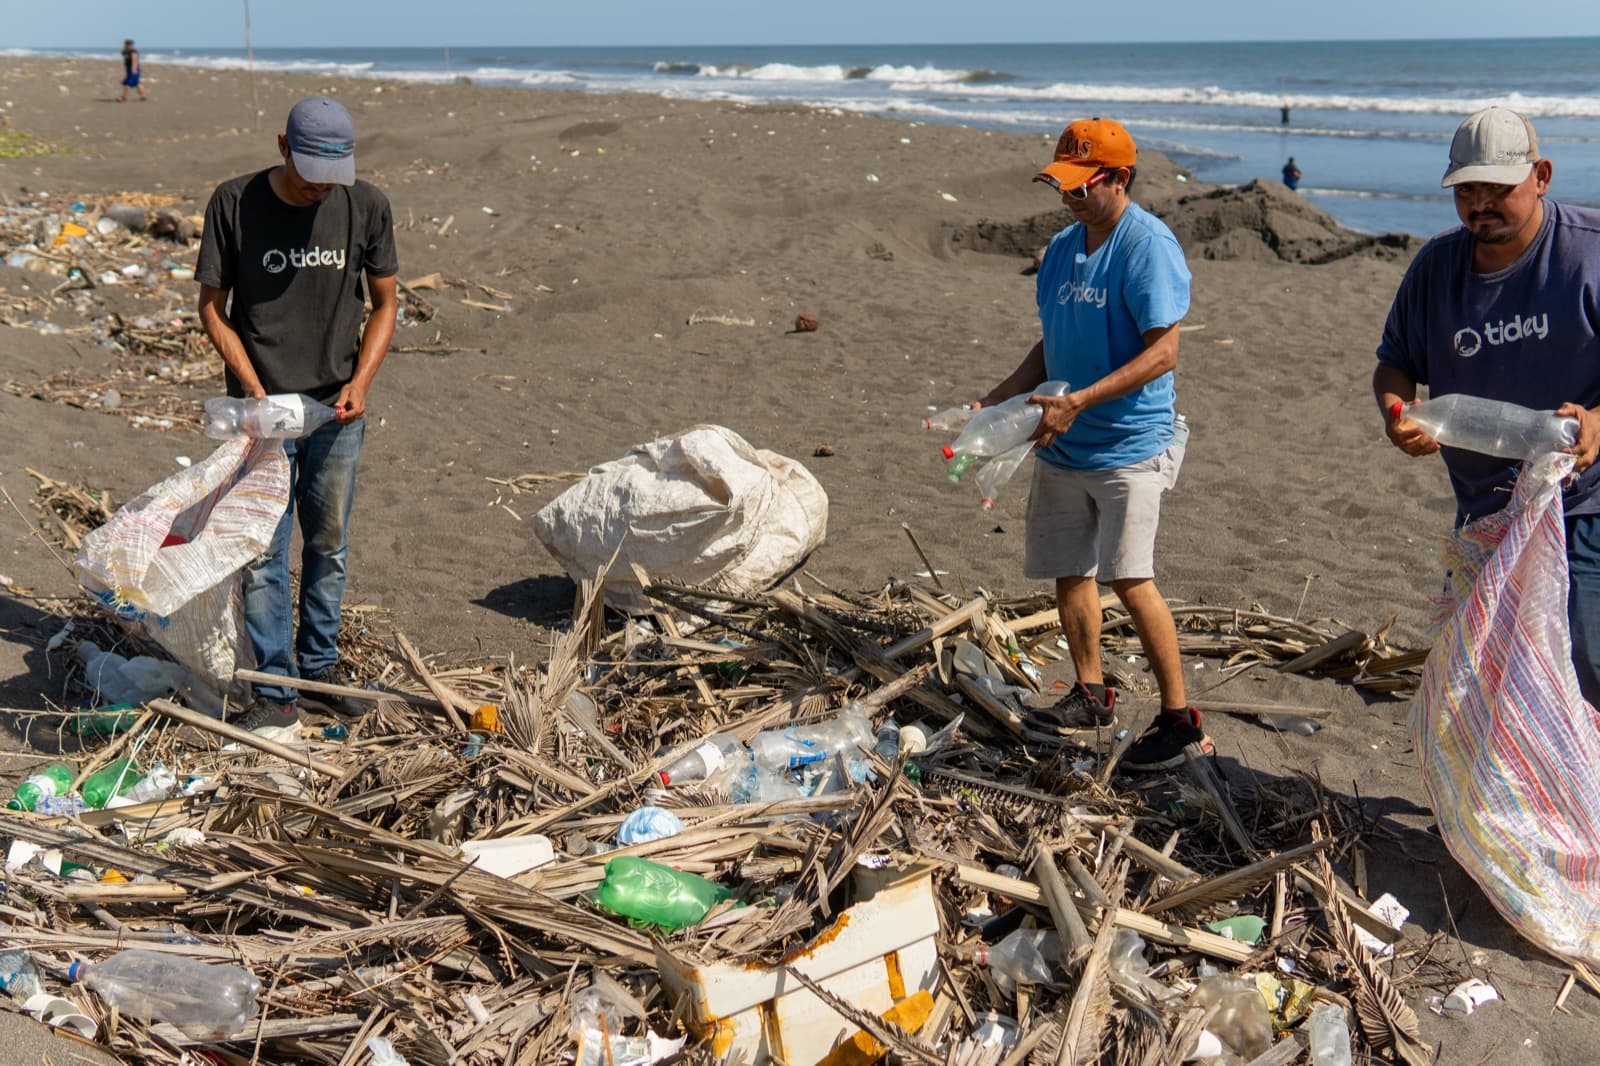
Most donors to ocean cleanup organizations have no reliable way to evaluate whether their contribution produced real environmental impact. The sector has a long record of striking imagery, large collection numbers, and limited transparency about how those numbers are generated. The result is a reasonable question: how do you tell the difference between an organization doing durable work and one that has learned to communicate effectively?
The answer is a framework, not a feeling. Six specific metrics separate organizations that can document their impact from those that cannot, and the standards are straightforward once you know what to ask for.
Cost per pound is the most commonly cited metric and the easiest to misread. A low number sounds efficient, but the figure is only meaningful in context. What does it include: collection only, or collection plus sorting plus recycling? Is the weight audited by an independent party or self-reported? Does the reported "pound" represent intact recyclable plastic or mixed debris that includes sediment, organic matter, and waterlogged material with negligible environmental value? An organization reporting fifteen cents per pound based on unverified weights of mixed debris is not necessarily more efficient than one reporting forty cents per pound for verified, recyclable plastic. The numbers describe different things. Tidey's fully loaded cost per pound is approximately forty cents and includes the full chain: collection, sorting, and recycling.
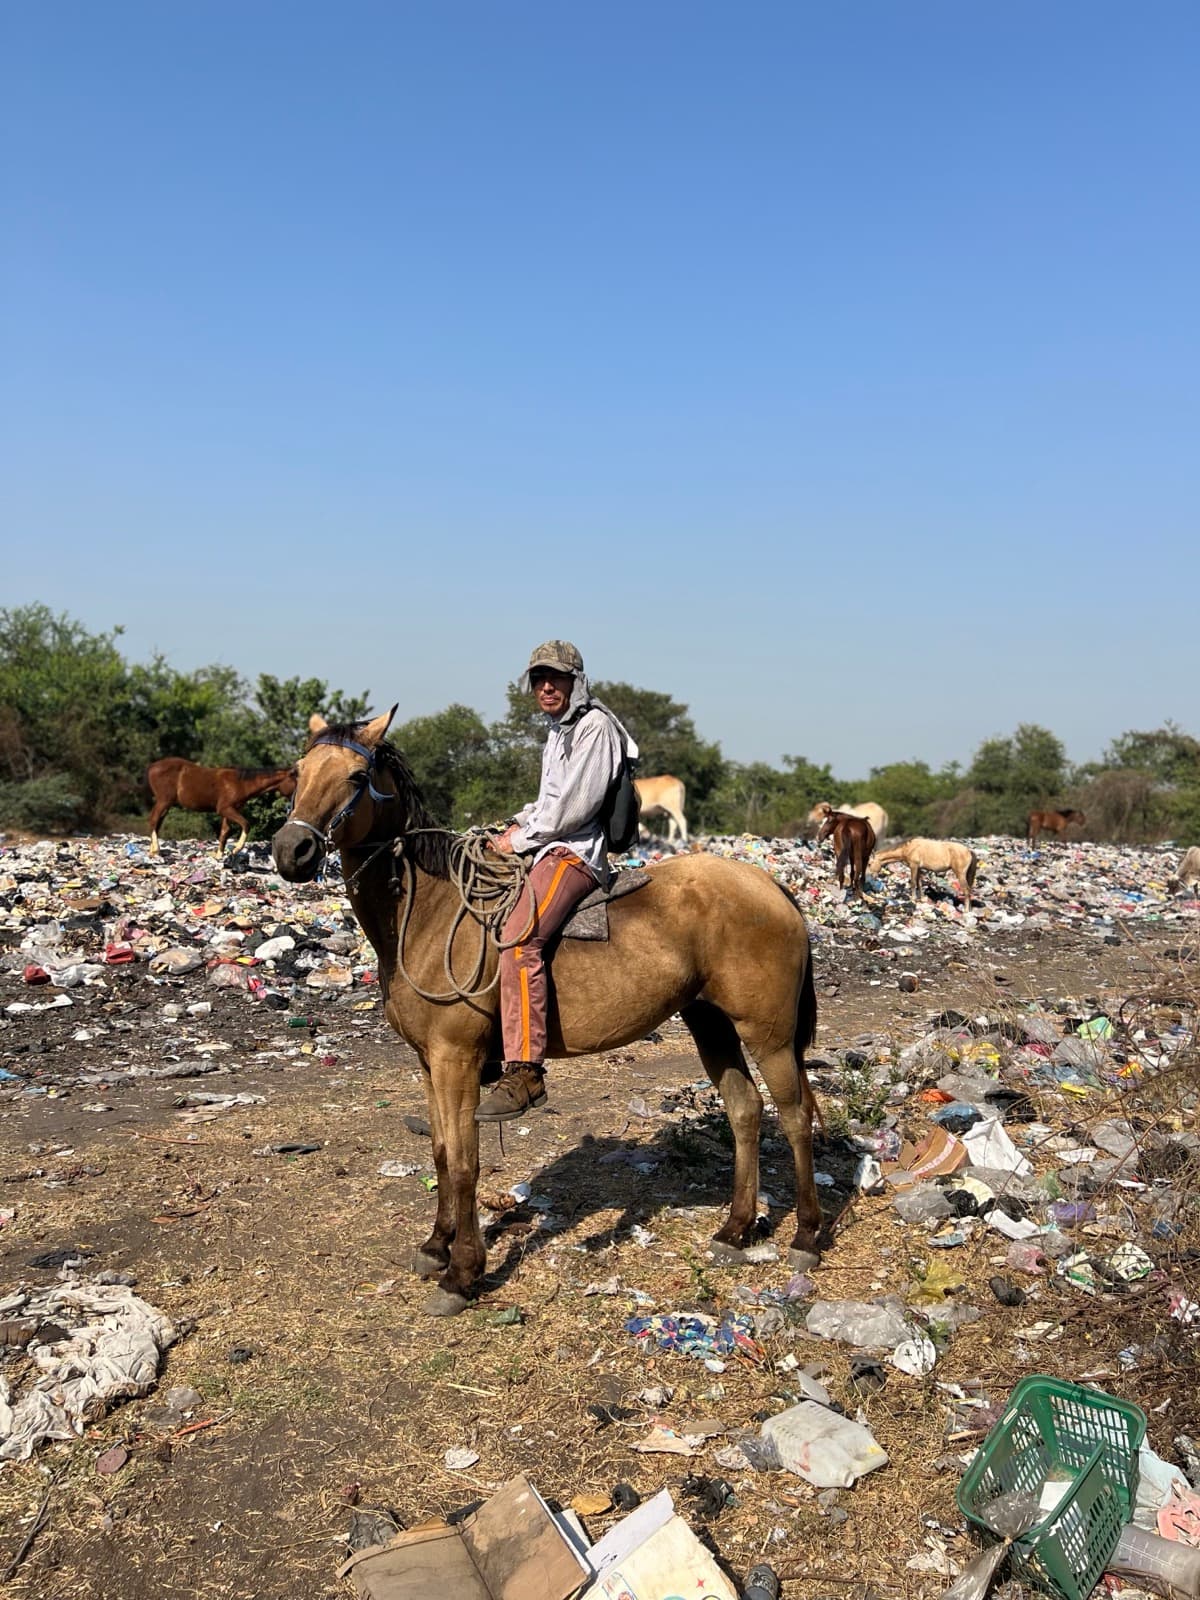
Additionality is the concept that most distinguishes high-impact work from cleanup activity that would have occurred without the organization's involvement. The question is simple: what would have happened to this plastic if the organization had not intervened? In communities with functional waste management infrastructure, the answer is often "it would have been collected by the municipality." The impact of diverting it is real but modest. In communities where waste management is absent and the alternatives are open burning and waterway disposal, the additionality is substantially higher. In coastal Guatemala, we estimate from field observation that approximately sixty percent of the plastic Tidey's collectors recover would otherwise have been openly burned, releasing toxic compounds including dioxins and fine particulate matter with serious respiratory consequences for the people living nearby. The remaining forty percent would have followed river systems to the Pacific. Interception prevents both outcomes.
Recycling rate is the metric that completes the collection picture. An organization can say it removed plastic from the environment, but if that material goes to a poorly managed landfill or is exported for informal processing under lower environmental standards, the claim is incomplete. Organizations committed to full-chain impact track what percentage of collected material is actually recycled into new products or processed responsibly. Tidey has sent 89.5 percent of total weight collected on to recyclers since 2022, with the primary materials being PET bottles, LDPE film plastic, and polypropylene string. We report the share that reached a recycler rather than the share that was theoretically recyclable, because those are different numbers and only the first one can be documented.
Verification and traceability are the layer that makes other claims auditable rather than merely stated. Any organization can report whatever number it wants. The question is whether that number can be independently confirmed. Tidey logs every collection transaction on the BanQu blockchain: collector name, weight, timestamp, and location. The record exists outside Tidey's internal systems and is accessible to donors and business partners through the impact dashboard. This is the same type of verification mechanism used in commercial supply chains where independent auditing of provenance claims has commercial consequences for buyers.
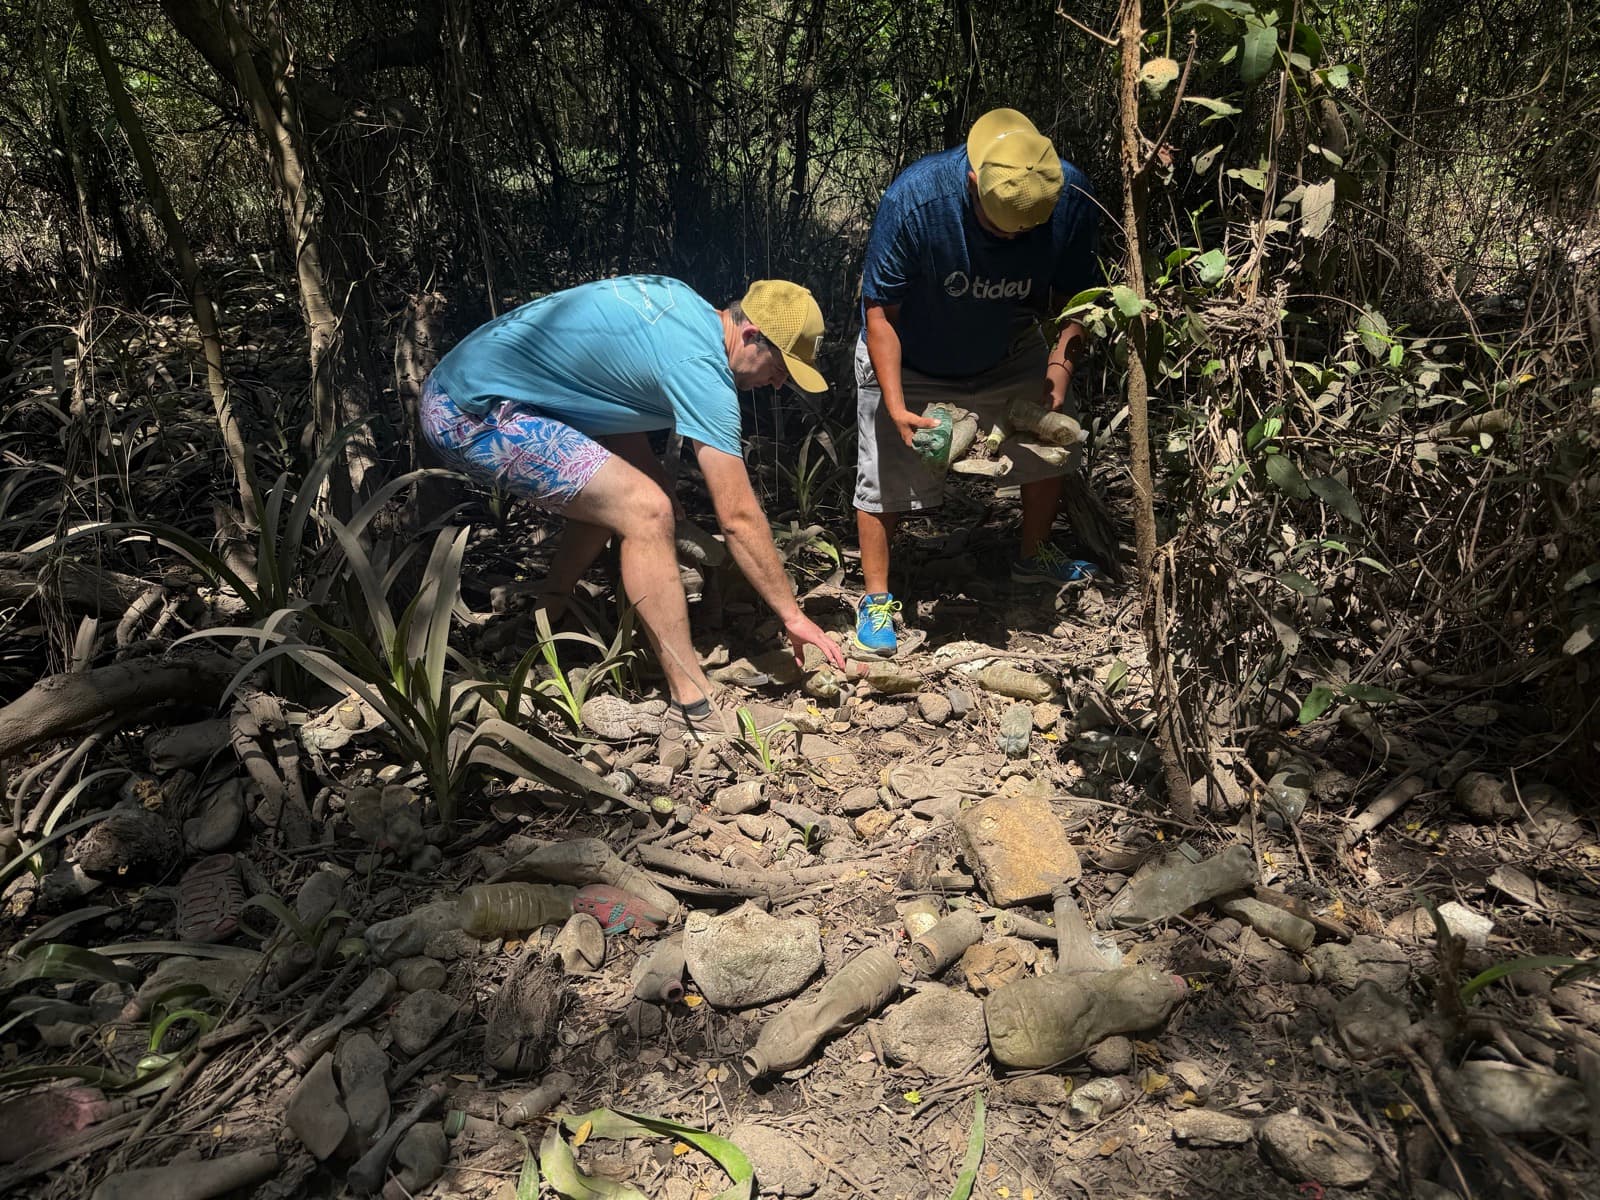
Community impact is a dimension that cost-per-pound metrics miss entirely. Organizing plastic collection in high-poverty coastal communities creates effects beyond the plastic removed. Paid collection work in communities with structurally limited income access builds local economic capacity. The most useful measure here is the number of people an organization pays directly, because a headcount is something an organization can count rather than model. Every pound Tidey collects is paid for at the point of collection, which means the environmental and social outcomes are produced by the same transaction: removing plastic and paying a collector happen simultaneously. An ocean cleanup organization that operates in high-poverty communities without creating meaningful local employment is solving one problem while ignoring the one experienced most directly by the people living around its operations.
Long-term sustainability is the final metric, and it asks the harder question: what happens to this community if the organization stops operating? Organizations building toward lasting change invest in education, infrastructure, and systemic capacity. Tidey's bonus point program is one mechanism for this: items like improved cookstoves, water filtration systems, and solar panels represent household-level investments that reduce ongoing costs and improve health outcomes independently of whether the collection program continues. Community education programs that teach waste sorting and recycling create knowledge that persists after any single organization departs.
Tidey's own numbers against this framework: fully loaded cost per pound at approximately forty cents including recycling; additionality high based on the burning and waterway trajectory for uncollected material; share sent to recyclers 89.5 percent since 2022; verification via BanQu blockchain accessible externally; community impact measured as the number of collectors paid directly, published in our annual report; bonus program investments that compound over time. The Ocean Cleanup's river emissions model, built on research published in Science Advances in 2021, estimates the Maria Linda and Achiguate rivers together carry roughly 3.3 million pounds of plastic to the Pacific annually, which is the scale of the problem Tidey is working against on Guatemala's Pacific coast.
What questions should I ask before donating to an ocean cleanup organization?
Ask for the audited cost per pound and what that figure includes. Ask what percentage of collected material is verified as recycled. Ask how collection figures are confirmed by an independent party. Ask what percentage of the plastic would have been openly burned or entered waterways without the organization's intervention. Ask how many collectors the organization pays directly, and whether that figure is a count or an estimate. And ask what the organization is building that will outlast its own continued operation.
How does BanQu verification work at the collection point?
BanQu is a blockchain-based supply chain traceability platform used in global commodity chains. At each Tidey collection event, the weight is recorded, the collector is identified, and the transaction is written to the blockchain. The record is permanent and accessible through the impact dashboard. Donors who want to verify a specific collection event, or who need to confirm aggregate figures for ESG reporting, can do so directly rather than relying on Tidey's internal data.
Why is that figure not one hundred percent?
Some collected materials are not recyclable under current infrastructure and market conditions. Heavily contaminated materials, certain composite plastic types, and degraded film may require alternative end-of-life handling. The goal is to maximize the recycled percentage and to ensure that what cannot be recycled is disposed of responsibly rather than re-dumped. Reporting the actual recycling percentage rather than total collection weight gives donors a clear picture of what their contribution produces.
Sources
- UNEP. Plastic Pollution and Marine Litter. https://www.unep.org/topics/ocean-seas-and-coasts/ecosystem-degradation-pollution/plastic-pollution-and-marine-litter
- OECD. Global Plastics Outlook: Policy Scenarios to 2060 (2022). https://www.oecd.org/en/publications/global-plastics-outlook_aa1edf33-en/full-report.html
- Meijer, L.J.J. et al. More than 1000 rivers account for 80% of global riverine plastic emissions into the ocean. Science Advances 7, eaaz5803 (2021). https://doi.org/10.1126/sciadv.aaz5803
- The Ocean Cleanup. River plastic emissions source map. https://theoceancleanup.com/sources/
Monthly, from the field in Guatemala.
Collection numbers, new research on plastic and health, and what we are learning in the field. No more than once a month.